News
Aerial Thermal Mapping of Solar Panels: Boost ROI & Safety – RAVAN AIR
The solar industry has evolved from a niche renewable sector into a high-precision infrastructure powerhouse. In 2026, the margin for error in solar asset management has disappeared. If you aren’t utilizing aerial thermal mapping of solar panels, you’re essentially leaving money on the table; or worse, risking a catastrophic site fire.
Aerial Thermal Mapping of Solar Panels: The 2026 Industrial Standard
For asset managers and O&M (Operations & Maintenance) teams, the challenge has always been the sheer scale of utility-grade solar farms. Manually inspecting 500 acres of PV modules is not just inefficient; it’s statistically unreliable. At RAVAN AIR, we leverage high-resolution UAV thermography to transform “visible” data into actionable financial intelligence.
Why Aerial Thermal Mapping is Critical for Solar O&M
The primary driver for aerial thermal mapping is the protection of ROI (Return on Investment). A single failed string or a cluster of bypassed diodes can degrade a site’s performance by 5%-15% annually.
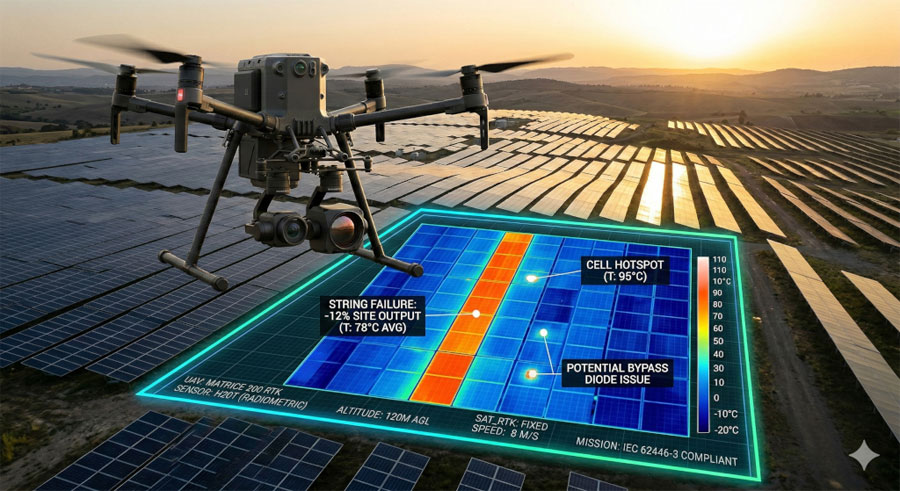
In 2026, we utilize radiometric sensors, such as the Zenmuse H30T or the Autel Max 4T XE—to capture temperature data at the pixel level. Unlike standard RGB cameras, these sensors detect the infrared radiation emitted by the panels. When a cell or component fails, it creates resistance, which manifests as a “hotspot.” These thermal signatures are the early warning signs of equipment failure.
Adhering to Technical Standards: IEC 62446-3:2022
Data integrity is one of our core values at RAVAN AIR. To ensure “bankable” reports that satisfy insurance providers and manufacturers for warranty claims, all our inspections adhere to the IEC 62446-3:2022 standard.
Compliance Requirements for the IEC 62446-3:2022 Standard:
- Irradiance: Flights must be conducted when solar irradiance is at least $600 W/m² to ensure anomalies are visible.
- Ground Sample Distance (GSD): We maintain a GSD of <3cm/pixel for detailed inspections, allowing us to see individual cell defects.
- Viewing Angle: Sensors are maintained at a tilt of 30° to 90° to minimize glass reflectivity, which can spoof thermal readings.
Anomalies That Can Be Identified Via UAV Thermography
When using aerial thermal mapping of solar panels, we categorize the defects found into three primary levels based on severity:
- Cell-Level Defects: Micro-cracks, soiling (bird droppings/dust), or PID (Potential Induced Degradation). These appear as isolated hot spots.
- Module-Level Failures: Junction box failures or shattered glass. These often show as a completely heated panel.
- String & Inverter Outages: These are the “heavy hitters.” A cold string in the middle of a hot afternoon indicates a complete circuit failure, often caused by a blown fuse or a disconnected cable.
Common Questions Answered About Solar Panel Surveys
What is aerial thermography?
Aerial thermography is the process of using drone-mounted infrared sensors to map and analyze heat signatures across a landscape or infrastructure. In solar, it allows us to see electrical resistance and thermal stress that are invisible to the human eye.
How does thermal imaging help solar panels?
It identifies underperforming assets in real-time. By spotting a hotspot early, O&M teams can perform “surgical” maintenance, replacing one module rather than troubleshooting an entire block of the array.
What are hotspots in solar panels?
Hotspots are areas of high temperature that occur when a solar panel cell is forced to consume power instead of generating it. This is usually due to shading, damage, or internal cell failure. If left unchecked, they can lead to backsheet melting or fire.
How often should solar panels be inspected?
For utility-scale sites, we recommend a bi-annual thermal mapping schedule. This ensures that seasonal changes in tilt or vegetation growth don’t impact your energy harvest.
The RAVAN AIR Advantage: Data Precision in Mid-Atlantic and Beyond
Headquartered in Conneaut Lake, PA RAVAN AIR understands the specific challenges of the Appalachian and Great Lakes climate. Whether it’s the heavy soiling from regional industrial activity or the thermal stress of fluctuating temperatures, our UAV teams are equipped to deliver survey-grade thermal orthomosaics.
We don’t just provide “pictures of hot spots.” We provide a georeferenced digital twin of your solar farm. Every defect we find is tagged with precise GPS coordinates, allowing your technicians to walk directly to the faulty module without searching.
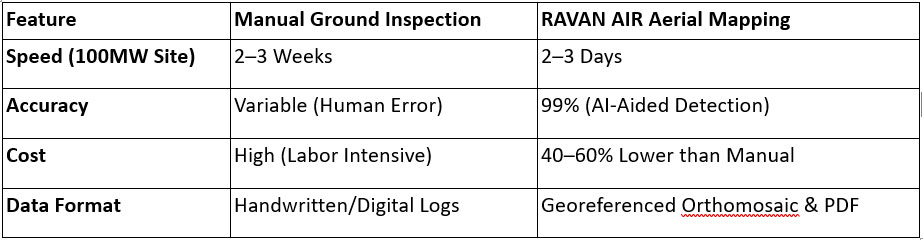
Summary Table: UAV vs. Manual Inspection (2026)